Friday, 29 April 2011

Syz’s Altin Zigs When Others Zag

ALTIN AG (LSE:AIA) (SWX:ALTN), the Swiss alternative investment company listed on the London and Swiss stock exchanges, discloses quarterly its entire hedge fund portfolio holdings as part of its policy of full transparency to investors initiated in 2009. Looking at the strategy allocation shifts of the fund of funds managed by Banque Syz makes an interesting contrast with the expressed biases of investors in hedge funds given in the Deutsche Bank Alternative Investment Survey.


Graphic 1. Net Allocation Plans by Strategy of Hedge Fund Investors


Source: 2011 Deutsche Bank Alternative Investment Survey

Asked in January this year, the respondents to the survey ranked as the top three strategies for receiving allocations of capital in 2011 as equity long/short, event driven and global macro. So it was striking that the Alternative Asset Advisors SA, the subsidiary of Syz that manages ALTIN AG, had acted in exactly the opposite way over the first three months of the year. As the fourth column in graphic 2 shows the largest reductions in strategy allocations made by 3A were in equity long/short, event driven and global macro.

Sometimes reductions in allocations in portfolios of hedge funds are effected through a passive route. That is as flows come in, net new subscriptions are allocated to preferred strategies, and the strategies or managers with sufficient allocations at that point are diluted. But ALTIN is a closed-ended investment company, so the capital available to invest changes with new capital raisings on the stock exchange and with leverage. There have been no capital raising (in fact shares in ALTIN AG have been bought back), and leverage at the portfolio level is broadly the same over the first three months of the year. So in this case the reductions in allocations to strategy are active decisions based on a number of possible factors. The factors are views on prospective returns at the strategy or individual hedge fund level, and (fund of funds) portfolio composition issues. That is reductions may be driven by bottom-up factors (marginally high allocations to a single fund that needs to be trimmed after very strong performance or changes at the firm), or driven at the highest level of management (portfolio level leverage as a function of hedge fund returns across all strategies), as well as at the intermediate level of strategy allocation. In this case the changes seem to have been made at the intermediate level because two funds have been added that invest using investment strategies that were not represented in the portfolio at year end.


Graphic 2. Breakdown of Capital by Investment Strategy of ALTIN AG


Source: Regulatory News Service of the London Stock Exchange

The two new funds are ZLP Offshore Utility Fund Ltd (an equity market-neutral fund) and Providence MBS Offshore Fund Ltd (a fund investing in mortgage backed securities (MBS), under Fixed Interest Strategy in table above). The first of the new funds is a sector specialist fund that adds value by the application of deep knowledge of one industry. The market-neutral fund, managed by Zimmer Lucas Capital of New York, should produce a return stream with a low correlation with traded markets. The managers of ALTIN know the managers of the fund very well – 3A were early backers of Zimmer Lucas Capital as far back as the year 2000.

The Providence MBS Offshore Fund Ltd is managed by Russell Jeffrey, founder of Providence Investment Management LLC of Providence RI. The $895m fund takes a relative value approach to residential MBS, and capitalizes on price dislocations in the agency MBS and related fixed income markets. The fund has a CAGR of 23.44 % since inception in 2004, and over the last 3 years it is ranked in the top 0.1% of all hedge funds for absolute returns.

The Deutsche Bank survey of investors in hedge funds showed no net interest in investing in either equity market-neutral or dedicated fixed income strategies in 2011. So it is not just in reductions in allocation to strategies that the managers of ALTIN zig when others zag, but also in new subscriptions to hedge fund investment strategies.

Tuesday, 26 April 2011

Selecting the Best Managers – a natural bias to hedge fund managers?

I carried out manager research for an American fund of hedge funds for several years early last decade. Manager research and portfolio construction is a team effort so I had to find a way to put across to my colleagues the merits of the managers I followed. We use a lot of inputs to understand how managers manage capital, so in our heads each of us has a multi-faceted view of the portfolio manager and his process, but it is not feasible to put it all across to someone else. So we have to find ways to summarise and capture the essence of our take on the hedge fund manager.

In my case I used a numeric score of what I considered then, and still do now, the key drivers of performance. So I gave each manager a score between 1 and 10 for each of source of alpha and for risk management. Risk management included portfolio construction, position sizing, diversification, risk measurement, downside risk and use of stops. The source of alpha score took into consideration the added value of the specific person/people pulling the trigger, the breadth and depth of research, whether there was a unique or unusual information source being used, the sustainability of the manager's edge, how adaptable the approach was to change, and the richness of the opportunity set being addressed. A mid-ranking manager would score 6 for each, in the way I used the scales, but this was a closed marking system. No manager ever got 10 for either metric. I never gave any manager a score less than 4 for alpha or risk management in the time I carried out manager research. At the bottom end it is easy to understand why: managers setting up a hedge fund have nearly always has significant success previously in trading or investing. They are not neophytes; and though some learn on the job about managing capital in the hedge fund format, they have all managed capital before.

After a while meeting managers, and hearing how they do what they do, I realised that whilst the alpha score was important, risk management was a bigger differentiator. So getting into risk management issues early in the process saved a lot of time and effort: if a manager didn't have discipline and a consistent process in risk management it was time to move on to another hedge fund.

A legacy of this time is that I remain interested in how to assess managers – it is useful in my consultancy work, at the least. In the book I am reading at the moment – "Investing with the Grand Masters" by James Morton – I am engaged to see what criteria the author used for selection of the managers.

So I was interested to read about the Skandia Investment Group's Best Ideas fund range. Skandia has a fund platform and operates multi-manager funds, but the Best Ideas funds are not a standard fund of funds. Neither are they portfolios of pure hedge funds. These are portfolios of funds (mostly long-only funds) run by well-regarded portfolio managers who have been given the freedom to invest in their highest conviction investment ideas on a dedicated basis.


The lead manager on Skandia Investment Group's Best Ideas fund range, Lee Freeman-Shor, applies four key pieces of academic investment research to his selection process. These are:

1. High conviction investing: Research from Randy Cohen of the Harvard Business School, Christopher Polk and Bernhard Silli of the London School of Economics suggests that the bulk of fund manager's returns come from their highest conviction ideas. As a result the Best Ideas managers are limited to holding only ten stocks, their ten highest conviction ideas.

 2. Kelly Criterion: a formula first described in 1956 by John Larry Kelly to determine the optimal betting size to maximise wealth. Perhaps the most famous Kelly practitioner is Warren Buffet who once said: 'Why not invest your assets in the companies you really like? In 1972 Buffet had 42% of Berkshires assets in American Express. Freeman-Shor allows the managers to apply Kelly to the extent that they can invest up to 25% in a single stock.

3. High Active Share: this measures the proportion of a fund's assets that differ from the benchmark index. In their 2009 paper 'How Active is your fund manager? A new measure that predicts performance' Martijn Cremers and Anti Petajisto indicated that running a fund with a high 'active share' delivers the highest and most repeatable returns. The European Best Ideas Fund has a high active share, currently 83%.

4. Behavioural science: Research by Andrea Frazzini in 2006 showed that the best performing managers realise the highest proportion of losing trades. Freeman-Shor's job as overall portfolio manager is to be a coach and work with the Best Ideas managers to ensure they do not succumb to, amongst other things, sunken cost bias when they are losing and are thus executing their ideas appropriately.


In a good hedge fund there is a competition for capital between the investment ideas – that is, all full sized positions are conviction ideas. So the concept of high conviction investing is seen in the hedge fund world. The Kelly Criterion applies in several hedge fund strategies – event driven investing, activist investing, and to a lesser extent in global macro investing. The third piece of applied research might just say why hedge funds have inherent qualities relative to long only strategies, as 100% of many hedge fund portfolios are active bets. There are no index constraints in hedge fund portfolios, though the presence of positions held only to hedge impacts the percentage of the portfolio applied to seek alpha.

The fourth piece of academic research applied to the Skandia Best Ideas funds has a very strong resonance for me. The conclusion from Frazzini is that the best performing managers realise the highest proportion of losing trades. From my work with traders I know that this can be applied with minor tweaks in hedge funds: the best traders realise their losses either early, or in line with their stated stop-loss policies. This allows winners to run, and losers to be cut. This characteristic is also often seen in systematic approaches to markets, particularly by CTAs. With good money management it is feasible to run a successful CTA with a hit-rate (percentage of winning trades) of only 35%. The hit-rate in a discretionary money manager has to be a lot higher, and for a fundamentally driven manager with a long holding period the hit-rate can get into the high 80's as a percentage.

The fruit of the application of these concepts has been good – the Skandia European Best Ideas Fund has shown some strong out-perfromance. On the third anniversary since launch the fund was 17% ahead of the MSCI Europe index and 15% ahead of its peer group (Morningstar European Large Cap Blend), putting it in the top 5% of European funds since inception and 1st quartile over all time periods.

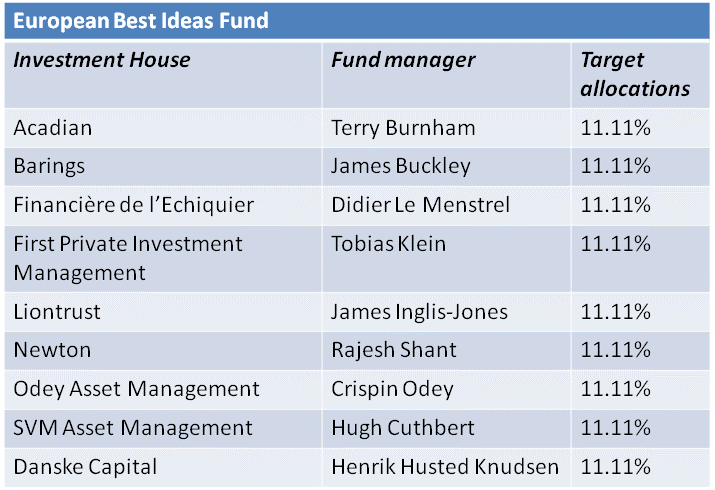
There are a number of hedge fund managers and managers of absolute return funds amongst the roster of managers employed by Skandia in the Best Ideas Funds. In fact I would go so far as to say that there is a disproportionate number of such managers amongst the portfolio managers used (see tables below). Would that be because hedge fund managers tend to apply the best portfolio management practices given by Skandia more than long-only managers?


Monday, 18 April 2011

Past the Low Point for Funds of Hedge Funds

It has been a tough time for funds of hedge funds post the Credit Crunch. At last it looks like the aggregate assets under management are beginning to emerge from the prolonged bottoming phase. Three months ago there was a comment here on the flat-lining in asset flows for North American funds of hedge funds. But the latest survey evidence from Preqin shows a rather more constructive outlook. 

Whilst the aggregate is little changed:


Graphic One: Aggregate Fund of Hedge Funds Assets under Management


Source: Preqin


The detail shows that more of the fund of funds sector is experiencing positive changes in AUM:


Graphic Two: Changes in Fund of Hedge Funds' Assets under Management since 2007


Source: Preqin

  • The proportion of funds of funds experiencing a fall in assets has gone from a substantial minority last year (42%) to only a small minority (17%) this year.
  • Much more of the industry has experienced stability in AUM this year – 55% of FoFs have seen no change in assets so far this year compared to last year.
  • The proportion of funds of hedge funds having an increase in assets is up to 28% in the 1Q of 2011.

If these trends continue the total AUM for funds of funds could rise towards $950bn by year end, in Peqin's estimation. This would be a good fit with evidence suggesting that institutional investors will be increasing their allocations to hedge funds. According to the recent Deutsche Bank survey on hedge funds, in aggregate institutional investors do expect to increase their allocations to hedge funds in 2011. The majority of investing institutions (77%) expect to keep their allocations as they were, but more (21%) expect to increase allocations in 2011 than decrease them (2%).

 
The outlook for funds of hedge funds is the most positive we have seen for at least 3 years. Preqin's version is


"The fund of funds landscape is markedly different to the pre-crisis industry. Assets under management for the industry as a whole are much lower and there is a bimodal distribution of firms emerging, with peaks at the lower end of the scale as the smaller niche boutiques appeal to the maturing hedge fund investors, and at the larger end of the spectrum the "brand name" multi-strategy firms still prove appealing to the newer investor. After a difficult few years for funds of hedge funds, the managers that have appropriately adapted to retain investors from the institutional market have regained some lost confidence and numerous new funds are poised to be launched this year. Growth of industry assets is again in positive territory and if this new era of revived investor interest in funds of funds continues then aggregate AUM will begin to climb towards the $1 trillion mark."


The fund of funds part of the hedge fund industry is not going to return to growth in the way it experienced it before – not all funds of funds will benefit in this more mature phase of the industry. But in aggregate the low point for the sector has been passed.


Thursday, 7 April 2011

Consulting Two - No Explicit Cost v Negative Carry Option Strategies

In my consultancy work I have been surprised by the frequency with which I have come across zero-cost strategies in options. Traders and portfolio managers find them more alluring than they should. It is as if these strategies intrinsically have more merit and deserve more attention. They don't.

To take on an options strategy, in say an equity index, the trader or PM must have a view on the underlying. To have an informed view the trader must follow the instrument closely – this allows them to attach probabilities to the possible broad scenarios behind taking a view via options. So the thinking may be that the index has had a good run and is beginning to act tired; that is there is limited upside from the current level. Or it could be that a particular share has formed a double bottom, there is good value in them and selling might begin to dry up. The first scenario is one that might suit an over-writing of call options. The second might fit an underwriting near current levels by selling put options.

To simplify market activity there are three broad outcomes possible – a trading range, a further significant rise, or a significant fall. Lesser directional movements are captured in the trading range scenario. The money manager or trader will have views on the likelihood of each of these, or to put it another way, if pressed most money managers could attach probabilities to the three broad outcomes. The money manager might have a view that the odds of a significant decline are small, say 10%, but having had a good run the odds of a trading range to consolidate the rise is quite high, say 60%. And the chances of further significant upside are greater than the chances of a significant fall, given the evidence of new buyers – so the odds of a significant rise are 30%. Whatever the exact percentages, the trader will have his own take on what the probabilities are of the three possible outcomes. It is his own probabilities which need to be fed into the construction of an option strategy to make it a fit of his view.

Of course the further significant rise might follow an intermediate pause for refreshment in the price of the shares or index. The extent of time taken to consolidate or pause is a key point. This is the time frame factor, and all managers have a time frame in which they add most value. This is the period over which they generate alpha. If they are a scalper, they shouldn't be taking a view over the next quarter, and a fundamentally-driven stock selector should not be looking to implement a view over the next couple of days. If a manager has a variant perception on earnings, for example, that would normally emerge over several quarters rather than over a week. All option strategies have a time frame, fixed around the months of the option maturities. To be a good fit for the trader the option strategy has to take place over the right forecasting horizon for them.

In a commodity market traders will know the price level at which industrial users will be highly likely to come in to buy. They may know the price zone when commercial hedgers have historically increased their open interest. In the world of equities a manager will have a clear idea of where value is emerging in a particular stock, and where companies buy-in their own stock. In fixed income traders will know at what interest rate funding becomes attractive to a particular category of market participant. So the portfolio manager or trader will have his own mental map of the significant levels of the markets they follow as they see them. In contrast, traded options are bought and sold for strike prices set at intervals by the rules of the exchange on which they trade.

The currency of option trading is volatility. So it might be said that the vol on a class of options is at least a couple of points rich compared to its recent history. Or that the smile of the volatility curve is particularly skewed because of a recent freefall in prices, meaning that out-the-money puts are expensive relative to those with strike prices near-the-money. The 3-D volatility surface is what the options market maker takes his view on.

The users of options may or may not have a view on volatility per se. The users may have opinions on levels and how long it might take for moves to develop and mature, and what probabilities they attach to scenarios for their markets. Professional traders will have a view on vol. Portfolio managers who read a lot of fundamental research and meet company managements are unlikely to have a strong or well-informed view on option volatility by class, never mind by strike. So having done option training, PMs will know what implied and realised volatility are, but it is not the element on which they are typically able to take a well informed view. It is not their currency.

So it is that option strategies are often expressed in the language of levels – strike prices plus or minus net premium. For simplicity pay-off graphs tend to illustrate possible outcomes at maturity. This makes the marketing of strategies more straight forward, and expresses strategies in terms closer to those most readily understood by the widest number of portfolio managers. It does little for suitability or fitting with a manager's market view. And so we come to "zero cost" option strategies.

Zero-Cost Strategies
 
Zero-cost strategies would not matter much were it not for the frequency with which they are implemented. After all the PMs are all grown-ups and they can always say no to an options strategy proposal. But the allure of the cachet of no explicit cost seems to be very strong with the buy side. So a disproportionate number of strategies are created, sold and implemented based on the appeal of no up-front premium outlay.

The typical circumstances are that, for a give maturity, the premium attached to a near-the-money strike option happens to be twice the premium for an out-the-money strike option. This means that, taking account of one side being on the bid and the other on the offer, an investor can receive as much premium for selling two lots of options O-T-M as they pay for buying one lot of A-T-M options. The payoff profile is rising profit through to the OTM strike, and from that level out a declining profit.

Sometimes the ratio between the strikes dealt in is not 2:1, but say 5:2, but overwhelmingly in reality the zero cost collar or put protection is sold and implemented using a ratio of 2:1. The outcomes are then much more intuitive to comprehend (and pitch).

In the process of putting the strategy together the strike levels and maturity of options are selected to fit the template that the purchased premium outlay should be offset by the premium received from the options sold. Occasionally, when the term sheet is put together by a less experienced sell-sider, the O-T-M option is struck further out in time than the near the money option. This diagonal call spread/put spread is less elegant to sell and understand, and utilises two time horizons.

Now going back to the portfolio manager's use of options, he or she should use traded options when they efficiently implement their views on markets, and within their style of investing/trading. Their views come in several aspects: their own take on what the probabilities are of the (three) possible outcomes in the specific market; their own mental map of the significant levels of the markets;  and they should take views via option positions over a time-frame that has a resonance with their own horizon for adding value.

Explicitly stating the elements going into the views on markets makes plain how specific they are to the trader or portfolio manager. It may well be possible to express the market view of a portfolio manager using options – so the time frame, probabilities and significant levels match what can be achieved and structured in the options market. That can be guaranteed to happen using over the counter options; that is, using bespoke instruments. To a degree using pre-existing strikes, dates and a given volatility surface of traded options will always be a compromise versus that ideal fit.

Lay on top of that that zero-cost strategies are put together when there is a conjunction of option maturities, skewness and strikes that just happens to give a ratio of 2:1 in premiums, and the impartial observe can see that zero cost strategies are a very artificial construct. Further it is plain that in order to put them on portfolio managers or traders are quite conceivably having to compromise their own market view in some dimension to accommodate the implied view of the zero-cost option strategy. So the real cost of the zero-cost strategy is not the premium expended, which by definition is nil, but the potential for a significant compromise with the actual market view of the risk taker. This mis-match is too often the cost of the zero-cost option strategy.

Using Negative Carry Strategies
 
Parenthetically, the inverse of the driver of the zero-cost options strategy, has produced great returns in some hedge funds. Rather than be a net seller of gamma (through being short one unit of O-T-M delta) some of the most successful trades of all time have been long long-dated optionality. Being net long of option premium comes at a cost – there is time-value erosion to cope with. But for some patient investors there is a big attraction in having a negative carry trade which gives well defined upside/downside parameters.

The "greatest trade of all time" is the definitive example of the successful negative carry trade. Mortgage backed securities have embedded optionality in pre-payment risk, but through derivatives on MBS specific tranches and indices it was possible to construct trades that would benefit from no payment risk – when mortgagees hand back the keys on their houses. So it is that the likes of John Paulson and Kyle Bass made billions on the subprime meltdown. There was an explicit cost to the trade, but the downside was known from the outset, and at least in the mind of the originator of the trade the real risks were in rolling over the positions – the collapse was going to happen at some point, though its exact timing was not foreseeable.

A similar set up was seen by Mark Hart of Corriente Capital of Fort Worth Texas. Like Paulson he created a dedicated vehicle to run a long long-dated option strategy to play one specific investment idea for the medium term. In the case of Hart, the fund he created in 2007 with the founders of GavKal, the European Divergence Fund LP, owned credit default swaps on European sovereign risk. Hugh Hendry of Eclectica is hoping for a similar payoff (7:1 and better) from using CDSs for taking negative views on China-related plays.

Another successful manager that uses negative carry options is Jerry Haworth of 36 South Investment Managers of London. 36 South has a diversified fund, the Kohinoor Fund, that only uses long-dated options and which has a 10 year track record. Haworth has also set up funds to benefit from specific tail risk events that use the same approach – for example the Black Sawn Fund that made 234% in 2008.

For each of these managers the use of negative carry option strategies gives a very useful attribute - the left side of the distribution of returns is truncated. That is the range of possible outcomes is limited on one side, which is the classic desirable skewed distribution of hedge funds.

Finally, some successful managers will not engage in negative carry trades with optionality on a structural basis in their fund. Rather for some long established and successful managers they see themselves as earning the right to start to use these strategies once they have passed a return threshold for the year. So once they have earned 8 or 10% (and therefore have every chance of producing a double digit year as a minimum) they will invest some of their profits to give a shot at making a banner year.

When I was Head of Derivatives at Clerical Medical I used to tell the investment professionals there that derivatives should be used to implement their views on markets when the instruments allowed that to be done economically. So in specific circumstances, for a particular money manager, a zero-cost collar may exactly fit their market/stock view. But the investment concept invested in, and the fit of the option tactic with the view is more important than the explicit cost, as the successful examples of the use of negative carry option strategies show. 


The first article in this series on consulting in the hedge fund business can be found at Consulting One

Wednesday, 16 March 2011

Working in Equity Market-Neutral – A Q&A with ABACO Financials

ABACO Financials Fund is a market-neutral equity fund with a European bias dedicated to investing in the Financial sector. The portfolio of long/short positions is structured to generate absolute returns by capturing relative value within the sector while targeting low volatility. The return stream produced for their growing list of investors has a high proportion of alpha in it, and the returns have low correlation to markets and to most equity hedge funds. Given the significance of the finance sector to the market turmoil of 2008/9 and to the prospects of European economic recovery since, the fund has been interesting to follow, not least because of the excellent market letter the managers produce.


The three investment professionals in the team have different overlapping roles: Inigo Lecubarri comes from the sell-side and spends the majority of his time on research; Louis Rivera-Camino has a background in portfolio management and works across all aspects of running the portfolio, and the following Q&A was conducted with Martin Deurell whose primary responsibilities include trading and risk control for the fund. The interlocutor was Simon Kerr.


Q. You had a very good performance in 2008, an excellent 2009 for a market-neutral fund and somewhat disappointing 2010 to follow. What happened last year?

Out of financial funds we did okay, but we were up only 2% after fees, and we are very far from happy about that. There are a number of reasons why financial funds did not do as well as other long/short equity strategies last year, and the biggest of them was the impact of the macro environment.

The over-riding theme for financials in 2010 was definitely macro, and teams like the ones we have really concentrate on financials from the bottom-up. That is where our effort is concentrated - in building our deep understanding of the individual companies and the drivers of stock returns. Yes, we'd like to think that financial specialists like ourselves would have a better chance of understanding the impact of macro factors on the universe of stocks we follow, but that is not the same as being any better at forecasting the macro-environment.

Post fund launch in 2003 the biggest macro driver was EuroLand convergence – that lasted through to 2009 in various ways. Making money for a sector fund was mostly about the attractiveness of one stock versus another up until 2009 - and then it changed.

From the environment of 2008 onwards, only the funding issue remains the same in 2010 – so the issue for financials is not the cost of funding. The markets treated stocks the same whatever their cost of funding – they all went down without discrimination.

The second headwind we faced in 2010 was the lack of consistent, strong long-only flows and outflows in our sectors of the stockmarket. These flows are important for the well-informed investors (such as hedge funds, and prop capital) to position against and take advantage of. Investors in hedge funds correctly buy into the idea that their (hedge fund) managers are able to anticipate investing institutions moving into sectors and stocks like tracking elephants moving in a forest. But in 2010 the investing institutions didn't move – flows went into ETFs and indices (country selection) dominated. If other categories of investors buy a banking ETF to take exposures that doesn't help a fund like ours which is market-neutral, and needs differential returns within sectors to drive returns. We are starting to see signs of flows out of bond funds and into equity funds as an asset allocation switch, and if that persists at the retail, or institutional level, that is going to help us.

Q. Was there anything you could have done differently last year to take account of this macro dominance?

If I was being hyper-critical I would say that we didn't put enough effort into tracking the impacts of macro factors in real time - you know, looking at the CDS market and what they say about our stocks. I have traded options in the past, so I know that looking at the implications of CDS pricing is like a put option determining the pricing of the underlying equity. The CDS market says something about where a stock might trade, but the CDS is structured around extreme events, and in any event the CDS market is a lagging indicator. So yes the equity has tended to move in a 1:1 relationship with the CDS, but that type of relationship may be unique to the time we have just been through.

At this point it seems the analysts who follow the financials sector are putting a lot of emphasis on their own take of the macro environment. This could even be at an extreme. There is so much emphasis being put on the macro component that the macro may still drive the individual equities in the first half of 2011.

Q. Does this have any implications to how you shape your portfolio?

Well it doesn't mean that I want to take a directional net long posture to equities, or the equities of financial stocks. As a generalisation, exposure to equity in financials is less attractive than fixed income at this point.

I think you can look for a rights issue to be a trigger for individual stocks. From the time when banks raise new equity they seem to outperform – Deutsche Bank is a case in point. It has out-performed since it raised fresh equity capital. The capital-raising by Nordic banks certainly helped their stocks to perform, though admittedly the operating environment they faced was not as adverse as for banks in some of the other territories. There is going to be a lot of issuance of capital in financials – some big equity raisings are coming in the next few months because they have to happen.

Q. Is capital raising good or bad for the bank stocks then?

The capital raising helps in a couple of ways. In raising fresh capital the banks are taking positive steps to meet the tougher capital adequacy rules. Also when banks raise equity they take big write-offs – so the asset value of the remainder of the assets is perceived as a harder (more credible) number. That said a number of the banks with investment banking business are still tight on capital – Barclays, Deutsche Bank and the French (universal) banks – the Swiss banks are probably okay for capital.

There are cross currents in looking at investment banks. There are negative regulatory impacts for them – they have to raise fresh capital and/or cut the levels of leverage they employ. The margins in trading have to come down – not just outsourcing of trading, but the intermediation of exchanges in OTC will bring down margins through increased transparency. Where they do lending, the net interest income may be softer looking forward. But their commission income should be up, and the prospects for M&A are good so long as they don't get too competitive on fees. We have them in the Fund, but I don't have a strong view on them myself. I don't have to – my colleagues Inigo (Lecubarri) and Louis (Rivera-Camino) sponsor the investment holding-period positions in the investment banks into the Fund. I do trade them quite often, but as the trader of the team I can tap into the expertise of the others for a strong fundamental view.

Looking at universal banks with significant investment banking operations like Barclays is difficult – they have an investment banking operation as well as retail banking and an SME business. You can't look at your DCF model and say this is what Barclays Bank is worth. There are just so many parameters changing all the time, and such a balance sheet that you never quite know about the quality of assets. It is very difficult to pin down a risk/reward on a trade and say that this is worthwhile taking a position here, even doing peer group comparisons.

There are a lot of (sell-side) analysts working on investment banks, but they all seem to do the same thing. They want to understand how the business is doing in the next two quarters – but that only seems to be used to justify the current share price. And talking to management and reading Dealogic about issuance seems to be about as far as they go. Yes the deal flow is the gravy in the business model, but in the present environment in particular, investors have to understand the balance sheet. No -one pushes the management on the balance sheet, and management is reluctant to talk about it on a current basis.

Q. Given the American investment banks report quarterly, do they give you insight into the European banks, or they too much outside your scope?

For our scope of fund it is valid to look at Morgan Stanley and Goldman Sachs. Goldmans has proved to be a different animal than the others – it always bounces back. Their network amongst politicians is first class, and they deal for so many clients that they are right on top of what is happening in flows in sectors. So the trading record is outstanding for good reason, but then again proprietary trading will be wound down, and some top people there seem to be leaving. I have successfully traded GS shares last year, but I felt I was a child playing with fire in doing it, and I have less confidence in my risk taking there this year. In general we are not massive experts in trading things on that side of the pond.

Q. How do you work with the sell-side as an information source?

We use the sell-side analysts for generating and testing ideas on a theme, and for tactical level trading. The hedge fund world is not like private equity – so we don't have the luxury of fixing a fair value for a stock and waiting four years for that value to be realized. We have to deal with regular valuation and marking our P&L to market. That means we have to be more aware of what the market is doing to valuation in the shorter term, and what the market is thinking on a stock.

So we tap into what the sell-side comes up with for ideas – sometimes the brokers' analysts will highlight something that we have missed in our screening. Our role then is to filter what is a good idea and what is a bad idea, and do more work on them. Sometimes what you initially think of as a good long idea can turn into a short position once you have checked out the market positioning on a stock - if the idea reflects the consensus on a stock we might consider going the other way. So then it's a "Short" not a "Long" and we can investigate the timing of taking a position.

Q. So if you are not taking many recommendations what do you use the brokers' analysts for?

We think you have to know all the analysts in the sector to know where the consensus on a company is. They can tell you where "the market" is on a stock, analytically and in terms of market positioning (holdings). The brokerage analysts can plant a seed of an idea – something that could be developed. And if you can find a good analyst it is good to test our ideas with them – to bounce ideas off them. If you can find an analyst who takes the opposite view from you, that is also useful to an investor. You need to test your argument – if you are a bull you need to test out the case of a bearish analyst by talking through his thinking. So then you know whether it makes sense to go against him. That is very very useful for a sector specialist fund manager.

To give you an example in a tactical sense, when we are approaching a company's results announcement- say consensus is at one level and an analyst comes along with a forecast outside the consensus. We might look at it and say to ourselves that the non-consensus analyst is right and the consensus estimates are wrong. In that case we can go long, say, and when everyone upgrades their forecasts the stock will go up. Or maybe the nasty figures are already discounted, and again the stock will go up on the earnings release.

Q. How do you differentiate between the analysts?

Of course the longer you have been in the game the better you know which are the good, and which are the bad, amongst the sell-side analysts. Also with experience you can trust a certain analyst – I know he is good on that stock, and someone else is really good on that bank. To find the analyst that is the expert on the Street on a company is very powerful. If you know the one that has done the most work, that knows the company intimately from following them over a long period of time, it is worth a lot. You may be able to ignore the other analysts on the company. I admit that it is a rare thing, such confidence in an external analyst, where they are the clear number one or two in knowledge on a company. But it can have a good pay-off. It can put you as an investor in a psychological disposition where you can comfortably take bigger risk.

We are fortunate in that we have such an analyst working in our own team. Inigo has been the number one ranked analyst on Portugese and Spanish banks, and to some extent he can tell others about what is really going on! This gives us a genuine edge in some stocks compared to the market.

Q. Would you say there are differences between how a hedge fund would use a buy side analyst and a sell-side analyst?

There is a substantial difference between the buy-side and the sell-side analysts on the risk/reward for a view on a stock. The sell side analyst has to live with his recommendation for a lot longer period of time. We have the luxury on our side of being able to moderate our view, as expressed in our position size, as we go along.

Q. Your presentation shows you as having specific responsibility for risk control. Are you the one that has to place the stops on positions?

It is not just my input on this. I carry out the dealing for the Fund but my colleagues put their own ideas into the Fund, and they propose how wide the stops should be. I don't apply a blanket hard stop. What I prefer to do is to place the stop in proportion to the volatility of the stock. So a more highly volatile financial stock will have a wider stop on it than a stock which acts in a less volatile way.

Also it is not as straight-forward as it sounds - looking at one position in isolation. We have related positions in our portfolio, so we may have put on two (hedging) short positions against one long position. So the catalyst for action can't be one share price in isolation, even if the P&L on that may be negative – there could be a long position down 40% and the shorts are down 35%, for a net loss of 5%. So the trigger level of an 8% loss has not been reached and so the stop would not be effective even if the three stocks are each down more than 30%!

There is another factor in the frequency of taking losses - the size of the P&L of the whole Fund has an impact. When the fund is doing well, and the P&L is positive, it is natural that the balance sheet of the fund is higher than when we have had to take losses. So it is much easier to run the profitable positions, and not be compelled to close the losers when the whole fund has a positive P&L (for the year).

Investors in the fund should also appreciate that there are some exit tactics to be deployed. So even where there is a stop level, not the whole of the position is changed all at once. I prefer to sell, say, half a long position at a level and then wait to see how it reacts for the remainder.

Q. Thanks for your time, Martin. You have given us a good insight into how you work with the Street, and how you manage the volatility of your fund so well. Good luck with the alpha harvesting in 2011.


Thanks.


Terms: Management Fee: 1.5%, Performance Fee: 20%, Redemptions: Monthly, Lock Up: No


The interview was conducted on the 12th January 2011.

Another article on ABACO Financials Fund can be found here.

Thursday, 10 March 2011

Bridgewater Associates in Numbers

Among the 1100 staff at Bridgewater there are as many as 130 client service personnel looking after around 300 clients.

  Bridgewater manages $87bn in assets.

    Ray Dalio's total remuneration for 2010 will be of the order of $3bn.

     The flagship Pure Alpha Fund produced its best year ever last year with a return of 44.8%.

      Pure Alpha was up 8.7% in 2008 when 70% of hedge funds were down.

       Bridgewater Associates is 36 years old this year.

        Asset growth has been at the extraordinary rate of 25% per year for the last ten years.

         Over the last 20 years the Pure Alpha Fund has produced a compound annual return of 18%.

   About 30% of the employees at Bridgewater quit or are fired in their first two years at the firm.


DATA SOURCE: AR magazine

Wednesday, 9 March 2011

The Grind Continues for Many Hedge Fund Managers

Whilst there is a constituency within the hedge fund industry which have obtained the Hollywood version of the trappings of success in the financial sector - the cars, the ranches, and the (part-owned) private jet - there is also a very long tail of funds which have not been in performance fee nirvana for some years.

Barton Biggs gave a very good  insight into the under-reported downside of running a hedge fund business in his book Hedgehogging. He told the story of an acquaintance who had put in a good year for performance, so collected a handsome performance fee for his added value. But as the manager's style of investment wasn't suited for subsequent market conditions, the following years were rough. The fund manager had to attend all his usual company meetings, read copious amounts of material, track stock market shifts, talk to his investors and put his ego on the line by selecting stocks. He had to put in long hours running his own small business as well as being a full-time professional investor - dealing with accountants, lawyers, budgets, planning, and hitting deadlines for regulatory filings and statutory reporting. All this while not making big money - in fact the big money of the fat year was ploughed back into the business for the subsequent lean years.

There are many challenges running a small business. In the hedge fund segment, in which the spoils go to the victors of the war of performance, not the least of the challenges is to retain (smart, professional, and mobile)  staff  who have no prospect of a bonus for some time. When the average hedge fund fell 19% in 2008 that presented the challenge of returning 23.4% to get back to the NAV of the start of that year. For most hedge funds that is two good years of returns. So staff could only get paid a meaningful bonus at the end of year three - that is, get paid at the start of year four! Hence staff defections from the hedge fund losers of 2008 was a theme of 2009 and into 2010.

The business school tenet for running a business like managing hedge funds is to build your expenses to be in line with your regular revenue, i.e. on the management fees. The performance fee is often characterised as the gravy in the meal, but if the base diet is thin gruel then gravy is not what a diner wants as a supplement.

And small gleanings are what have been available to many managers. It was reported here in a recent article that around half of Europe's largest hedge fund manager groups had not gathered more assets in the middle six months of last year - so the base revenues of the businesses were not expanding. However, by the end of September last year only 5% of the assets of the largest managers in Europe were not qualified to pay performance fees because of the high water mark feature. So by extension, with a further five months of positive hedge fund returns, most of the world's large hedge fund groups are now accruing performance fees. The well known names who run these businesses will be able to buy a larger house in the Hamptons if they choose. The more socially sensitive of them will be able to fund another urban academy in a deprived neighbourhood.

However, there are many dedicated hedge fund managers who will not be in a position to fund such largesse, or even take a house in Vail for the season. Eurekhedge reports that fully 42% of hedge funds are still below their end 2008 NAV at the end of February.

Thursday, 3 March 2011

Hedge Fund Radio - 7th March

You are cordially invited to listen to me join in the smorgasbord that is the Monday, March 7th edition of the Sony and Wincott Awards-nominated hedge fund radio show "The N@ked Short Club".


The programme host is pseudonymous; there is loose talk on hedge funds; and there is some heady music...
                               ...it is all combined for an hour of unique radio.
Tune in to "The Naked Short Club" on Resonance FM.

The guests next Monday, apart from me, are: Stephen Oxley- MD, Paamco; Stephen Pope- CEO, Spotlight; Tony Greenham, Head of Finance & Business- New Economics Foundation; Joy Dunbar- Editor, Absolute UCITS; John Davey- Senior Research Analyst, Bestinvest; plus, "by low latency Tantric link from the US," expert investor, commentator and seminar meister, Mike Gasior- CEO, AFS. Cultural content comes from BH Fraser, the City Poet.

The show, the Naked Short Club, is broadcast live from 9-10pm (London time) on RESONANCE FM (104.4FM within London / online worldwide via http://resonancefm.com/listen).

London Losing its Allure as a Trading Centre if Guggenheim Partners' Decision Making is Indicative

The politicians don't believe it when the British Bankers Association or AIMA say that tax-paying talent will leave the country, or when supply-siders say that the percentage tax take is hurting growth from entrepreneurialism. But there is evidence. UK based firms (including large cap names) have moved their tax domicile to Switzerland. Hedge fund firms founded and grown in London have opened offices elsewhere in Europe to avoid increasingly high personal tax, and to take some corporate revenue out of the UK. Several high profile leaders of hedge fund firms have left London. 

These are examples of indiginous tax paying people and entities moving outside the scope of the UK tax authorities, but there are also decisions being made not to come into the UK tax environment. London is the long-standing hub for global financial activity in the European time zone. There is no doubting London's historic position and ranking. Their is a complete range of markets in the UK's capital from capital markets to insurance and shipping to commodities and foreign exchange. So the talent pool is broad and deep, and the service support infrastructure is excellent for any sector. It is possible to find lawyers and outsourced I.T. firms and back office capability across the spectrum of tasks in London. London is expensive, particularly for real estate, and the physical infrastructure is strained, but it mostly works and everything necessary to start a business is readily available. 

The positive factors for London may not be enough any more. Guggenheim Partners LLC is a privately held global financial services firm with AUM of $85bn and offices in nine countries. It is setting up a proprietary trading platform to take advantage of the decline in bank trading with proprietary capital. Outside the United States Guggenheim Partners has offices in Dubai, Dublin, Geneva, Hong Kong, London, Mumbai and Singapore. The new venture, Guggenheim Global Trading (GGT), will have an Asian office (place to be decided), and it was a shock to read today that the European office for GGT will be in Geneva.  

These kind of decisions, to not come to London rather than actively leave the UK tax and regulatory burdens behind, are not headline grabbing and not something that can be taken as positive proof of the case. But there is collateral evidence that London is losing its allure as a trading centre.


Addition of 12th April 2012
It is unlikely to be related to recent tax changes in the UK Budget, but another hedge fund manager has left London for a lower tax regime. Changes on the FSA register show that the senior investment and operations staff of Tyrus Capital are no longer under the UK regulator's jurisdiction. Tyrus Capital was set up by Tony Chedraoui, the well-regarded former head of Deephaven's European investments, and is one of Europe's top 50 hedge fund firms by size.  Reports suggest that the management of the $2.7bn of assets run on an event-driven basis has moved to Monaco. 

RELATED POSTINGS: 
Hedge Fund Tax Drain (June 2010)
Mixed Messages on Health of HF Business (Nov 2010)

Tuesday, 1 March 2011

Europe’s Big Hedge Funds Not Growing from Net Subscriptions

Every six months the UK's Financial Services Authority conducts the Hedge Fund Survey (HFS) and the Hedge Fund as Counterparty Survey (HFACS) to help the regulator analyse the systemic risk posed by hedge funds. The latest surveys were conducted in September/October 2010, and the results were released yesterday.


The surveys give invaluable insights into the state of the European hedge fund industry. The HFS asks selected FSA-authorised investment managers about the hedge fund assets they manage and the large funds (equal to or greater than US$500 million in AUM) for which they undertake management activities. So the survey is top-down by size, but given the concentrated nature of the industry the survey well reflects the European industry as a whole, the UK regulator overseeing funds controlling around 80% of the European end of the industry.


The September 2010 survey covered about 50 investment managers with just over 100 funds qualifying by size. Together these firms reported approximately US$380 billion of hedge fund assets under management. The FSA estimate that the HFS captures approximately 20% of global hedge fund industry assets under management. Major American hedge fund groups with a London office, such as Highbridge and Moore Capital Management, will be in this survey.


There are a number of interesting and significant results in the survey:


1. Net subscriptions for large funds were negative in the six months to September 2010.
Aggregate assets under management increased in the survey period due to positive performance. But the picture of subscriptions and redemptions was more mixed. Approximately one half of large funds in the September 2010 survey reported a decline in AUM driven by negative net subscriptions (Chart 1). In aggregate, negative net subscriptions reduced assets under management by 0.8% versus the aggregate assets at the start of the survey period.

Chart 1. Distribution of Change in Large Hedge Fund AUM for the 6 months to end September 2010


source: FSA
2. There was little change of the size of hedge fund assets in side pockets
"Assets under special arrangements due to their illiquid nature, such as in 'sidepockets', remained largely unchanged at 11% of aggregate NAV, suggesting no improvement in the quality of these assets," according to the FSA.
 
3. Large funds in Europe have recovered to their high-water mark
Assets below their high-water mark have declined to less than 5% of total surveyed assets, down from 43% reported in the October 2009 survey. So the profitability of European hedge fund management companies should be much improved in 2011.


4. Hedge fund managers in aggregate have been able to agree a lengthening of their term of credit.
The term of financing has been 'pushed out' in aggregate, with a reduction in short-term financing of between 5 and 30 days and an increase in financing terms of 31 to 180 days (Chart 2). This gives more potential for stability within the portfolios, as positions will not have to be reduced because of a shortage of short term finance, as can happen when short term financing is rolled over on a frequent basis. The leverage providers are overwhelmingly the prime brokers.

Chart 2. Financing Term – Percent of financing by days


source: FSA
5. The average excess collateral held by prime brokers is as at the low end of the 5 year range.

The Hedge Fund as Counterparty Survey suggests that the average excess collateral is currently around 90% of the base margin required (Chart 3).The FSA notes that there have been developments in hedge funds' cash management which may impact the movement of collateral, such as an increased use of custody accounts for excess collateral.


Chart 3. Average Excess Collateral Held by Prime Brokers – Collateral as a percent of base margin


source: FSA
6. Commodity futures positions of hedge funds has become an issue of note to regulators, and should be one to investors and the funds' managers.

According to the FSA the footprint of surveyed hedge funds within markets is generally small when measured by the value of their holdings, suggesting that in aggregate they do not have a major presence in most markets. However, the regulator for most of Europe's hedge funds states that there are potential exceptions in convertible bonds, interest rate and commodity derivatives. Hedge funds have been nearly 5% of the open interest in commodity markets in the last year. These positions might be held for reasons of medium term value, but for most hedge funds the holdings are governed by momentum-based tactics. So the exit may become very crowded in some of the smaller commodity markets where hedge funds are relatively new, if large, market participants.
   
7. The relative decline of funds of hedge funds within the industry is illustrated again

FSA survey data shows (Chart 4) that the large hedge fund groups have well diversified sources of capital for their larger funds. A surprise in this analysis is the low percentage of capital of large hedge funds routed via funds of hedge funds – only 28% (or less) of capital of large hedge funds was contributed by funds of funds (and other funds). There may be some under-estimate of total holdings of endowments and pension plans in this data, as these institutions and HNWIs may have hedge fund exposure via FoFs as well as through direct holdings. However it is difficult to refute that funds of funds are contributing much less of the capital of large hedge funds in 2010.

Chart 4. Sources of Hedge Fund Capital for Large Funds at September 2010

source: FSA
 
Parenthetically, the FSA survey suggests that hedge fund managers themselves own over $30bn worth of their own hedge funds.

Thursday, 17 February 2011

A Shift in Risk Appetite?

I believe in Marshallian K – so excess money creation goes into financial assets if the real economy doesn't need it. This is what is going on now in American financial markets. We are seeing narrow money creation but not broad money growth. The St. Louis Federal Reserve is showing that the current money multiplier is less than 0.9, that is, printed money is not being multiplied by the banks to the typical extent (2.0-3.0).

What is interesting so far in 2011 is the change in where that money is going. In my last article I made a logical case for flows into stocks rather than bonds based on valuation. I doubted that the flows of mutual funds would reflect that logic, but I have been proved wrong by the data releases* of the Investment Company Institute since. Here is a table showing mutual fund flows on two time frames – the top part of the table is monthly data and the bottom part is weekly data for mutual fund flows this year.

U.S. Mutual Fund Flows

Source: Investment Company Institute

The Table shows some interesting shifts. The pattern last year was for positive bond flows and negative equity flows. Whenever equity flows went net positive last year it tended to be because positive flows to emerging market mutual funds outweighed outflows from domestic equity mutual funds. So for three quarters of the year in 2010 there was a large negative bias towards mutual funds investing in American stocks.

Towards the end of the year holders of mutual funds caught on to the increasing fragility of the finances of municipalities in the States and there were net redemptions from muni bond funds. The outflows from muni bond funds have continued this year. There has been a minor pick up in flows into taxable bond funds this year, and it looks like straight switching within bond mutual funds to safer havens. Net flows across total bond funds are a small positive – and really quite small compared to last year's positive net flows. So the key word in the bond mutual fund story in 2011 is small.

The key words in equity mutual funds investing in 2011 to date are growing and domestic. After some minor end year tidying up, the U.S. mutual fund investor has continued to buy overseas equity focused equity mutual funds as before, but the new new thing is the emergence of significant buying of domestic equity mutual funds. The market for mutual funds in the United States is not like in some European territories where the largest investor in a UCITS funds can be the sponsoring insurer or bank. In the United States, apart from money market funds where institutions own around a third of the assets, mutual funds are held by individual investors. Individuals own 89% of bond funds and 91% of equity funds. And the man in the street in the US has been buying domestic equity mutual funds to an extent not seen in at least four years.

Whilst individual investors are recent converts to the attractiveness of equities, institutional investors crossed that line some time ago and at this point are expressing fervour for the concept.  The Merrill Lynch Fund Manager Survey for February (survey period 4th-10th February) contains extreme conviction on the part of institutions. The Survey overview states "The February FMS is one of the most bullish in years. Institutions have record equity and commodity overweights, very low cash levels and the strongest risk appetite since Jan‘06." It also says that "Hedge fund net exposure rose to 39%, highest since July’07. Cash balances fell from 3.7% to 3.5%, triggering our FMS cash trading rule equity sell signal." 


A mirror of the rated attractiveness of equities is an aversion to bonds in the Survey - nominal bond allocations were very low; the lowest since April of 2006 and near record lows. This is the corollary of the view on inflation (and implicitly commodities) that expectations for global inflation were the highest since June of 2004.  There is a consistency of world view too in the consensus for economic growth. Just 13% of respondents expect the global economy to weaken in the next 12 months. 


Parenthetically it is interesting that professional money managers express the same sentiment now that mutual fund flows have expressed this year  - a strong bias towards the equity markets of the developed world rather than emerging market equities. The expressed appetite for U.S. equities is the second highest ever in the Fund Manager Survey. 


The mental positioning, and Dollar positioning, of investors in equity markets combined with expressed survey views on growth and inflation give a clear road map for contrarian investors. For example I would suggest that the views of Hugh Hendry put across here (Hugh Hendry's views) were for something other than where the consensus has got to. Equity markets are overbought, and extended to the upside. However, overbought conditions can persist and there is little internal inconsistency in the market action for a tape reader to find. One of the market observers I respect puts it that the broad market "continues to demonstrate bullish resiliency".


*Flow estimates are derived from data collected covering more than 95 percent of industry assets and are adjusted to represent industry totals in the weekly data. Data for previous weeks reflect revisions due to data adjustments, reclassifications, and changes in the number of funds reporting.

Friday, 4 February 2011

Stocks over Bonds for 2011

Just over a year ago I featured as my Chart of the Day the mutual fund flows for U.S. bond funds and equity funds. At that point I summarised the attitudes of retail investors as "keep me out of Wall Street, I want the return of my cash, and I can only trust Uncle Sam with my money at the moment, thank you." The updated chart (Fig 1 below) shows that 2010 had more of the same, that is, huge inflows to bond funds and net outflows from equity mutual funds.

                                  Fig 1. Monthly Net New Cash Flows to U.S. Mutual Funds by Asset Class


As at the previous point of review (December 2009) the logical case now is very strong for a preference for equities over bonds based on valuation. Looking at the P/E ratio of American shares in isolation the case is not particularly convincing as Figure 2 shows. The S&P 500 trades at 13.6x forward four quarter earnings – this level is neither cheap nor dear in an absolute sense. But the context is very constructive: inflation is low at the consumer level; interest rates, whether real or absolute, are low and will remain so for some time; and earnings growth may be a positive surprise in 2011 as expectations are low.

                                    Fig 2. P/E Ratio of U.S. Stocks based on 12m Forward Estimates


The earnings surprise at the market level could come because expectations are low and the American corporate sector is well set in several regards. First the operating leverage is good after staying lean and mean, and hiring has only recently begun. Secondly the level of the Dollar makes the U.S. internationally competitive (and exports accounted for 1.1 percentage points of the 3.2% increase in real GDP in 2010). Thirdly, and this will be very important this year, unlike the consumer and the government, the corporate sector has a good balance sheet in aggregate. I place an emphasis on the balance sheet because there is good scope for capital spending as well as hiring, and, most importantly for investor psychology, conditions are good for a lot more mergers and acquisition activity this year.

However, even if the earnings growth for 2011 only turns out to be in line with the current consensus, a strong case can be made for a preference for stocks over bonds on the basis of relative valuation. This is illustrated in Figure 3.

                                                      Fig 3. Yield Comparison for Stocks v Bonds 
                                               (Earnings Yield on S&P500 v Real Yield on 10 Year Treasuries)


The widening gap between the real yield on the highest quality bonds and the earnings yield on American blue-chip stocks (the inversion of the P/E ratio) reflects the neglect by investors of stocks relative to bonds. The risk premium for stocks now is higher than it has been for more than 80% of the last decade, and at nearly 3.9% is 1.6% higher than the average over the last 10 years. The logical case is very strong - on the basis of valuation investors should switch out of bonds and into stocks.

On the basis of investor psychology investors won't switch. The aversion of the man in the street to anything to do with Wall Street will continue. ETFs have continued to grow whilst equity mutual funds remain out of favour suggesting that Americans don't want to give money to stock-selecting money managers. Individual investors are dis-engaged with markets to an extent rarely seen before. In short, America has fallen out of love with stocks.

Friday, 28 January 2011

Top Macro Manager Talks Through Set-Ups, Triggers and Sizing Positions

This week I heard a presentation by a senior trader at one of the large global macro hedge funds which has been in business for nearly 20 years. He put across several insights into the way of working of those who engage in the strategy. The particular trades under discussion were in foreign exchange, in the Euro/U.S. Dollar, during last year.


Fundamental Set-Up

In FX there are three elements to the fundamentals that should be aligned for putting on a position, according to the trader. The first is valuation. In FX there are several valuation models which are commonly used though each has limitations. Purchasing power parity (PPP) for a currency pair is a value which is unobservable in markets, and is a conceptual level that actual FX rates pass through without pausing. Extreme deviation from PPP is taken as an under or over-valuation. The Economist uses the price of the ubiquitous McDonald's meal to calculate the "Big Mac Index", a guide showing how far from fair value different world currencies are. The Big Mac theory, which is based on an observable purchasing-power parity, says that exchange rates should even out the prices of Big Macs sold across the world.

The second element of the fundamentals to consider is the interest rate differential between the two countries on each side of the currency pair. This is not a static element, as the FX markets (spot rate) move with forward forward rates. So expectations of future interest rate differentials are what count. The relative growth outlooks of the two economies is what the senior trader emphasised in getting a handle on interest rate differentials. For my part I would say that the perceived prospects for medium term inflation are now taking a much bigger role in the mind of the market than hithertofor in looking at interest rate differentials.

The third fundamental element to a good FX set up for a macro trader is the policy environment. Last year presented a classic opportunity (in looking at Euro related trades) in that European politicians/central bankers commented on levels and movements in traded rates (CDSs as well as bond auctions and FX parities). Some of the great macro trades have been set up by governments attempting to talk down markets when their policy objectives clash with what the markets discount as sustainable. So last year was a classic of its type in this regard, though interest rate policy specifically was a stale issue according to the bulge-bracket macro trader. That is, changes to interest rate policy were not expected to be a driver of the market condition for the trade under consideration in the time-frame envisaged. For trades at the market level like those illustrated here, and particularly in FX it is very important to understand the market drivers at the time. The graphic below indicates what the macro trader stated were the major drivers for the €/$ level last year through the different phases.


Technical Set-Up

The technical set up for a macro trade can be about flows and positioning by the various categories of market participants (say hedgers, speculators and governments). For example, the Commitments of Traders report for listed US futures showed there were very high levels of Dollar bear positions just before the monthly employment report for July 2010 released on the 6th August last year. So the positioning in the market shifted the odds of the labour market data being bad enough to move the Euro up further versus the Dollar. That date marked an interim top for the Euro versus the Dollar.

The other form of commonly used technical set up is pattern recognition, which in its crudest form is chartism. Along with the rest of the market, the senior trader from the well-known global macro firm was onto the break in the multi-quarter uptrend for the Euro (versus the Dollar) that occurred in December 2009. The Greek debt crisis powered the multi-month fall in the Euro which lasted into the middle of 2010. The break in trend of itself is often a good entry point for a trade, but as FX markets have lots of minor reversals against the major trend traders have to have tools to identify the second and third high quality entry points as the new major trend unfolds. In the middle of January 2010 there was a good secondary entry point on such a short term reversal – as is typical the secondary entry point corresponds to a support/reversal level on the previous major trend – in this case around 1.45 on the €/$ in the period 13-15th January.

This secondary, high-quality entry point can be illustrated in another trade mentioned on this website – in Gilt futures (see here and here).

Technical Set Up for Trade in Gilt Futures Showing High-Quality Entry Point


The significance from a money management perspective is that the second entry point - as the security price accelerates away from a key support or resistance level - can be a higher conviction entry point than the first. This is because the investment hypothesis ("the market is going to go down", say) has been tested by market action and passed the test. So depending on style, the macro trader can trade in several risk units at the second entry point. In no way is the second entry point a secondary entry point!

The global macro trader also disclosed the use of a particular tool to assess sentiment – the world wide web. The fund monitored the occurrence of the phrase "quantitative easing" on the web in August, September and October to ascertain the degree of dominance in the minds of investors.


Trigger

Global macro trading is often about assessing the persistence of action by the various actors in the market drama. It was interesting that the senior macro trader said that the trigger for putting on the position was often the behaviour of the markets themselves. Note that the crucial observations are across markets, not necessarily from market action within the market under consideration. So for the €/$ last year the maturity of the Euro rally that began in June was under consideration in August by the trader because the co-movements of the S&P500 (as a proxy for global equities) and the fx rate diverged. The €/$ and the SPX had synchronised price changes for a period of some months, but over the first few trading days of August days the S&P was flat whilst the € was still appreciating against the $. For the macro trader this signalled a change of behaviour was imminent for the Euro/Dollar relationship because the S&P action signalled at least a pause in the driver for the FX rate (the slowing US economy). To quote the trader directly, "divergences between markets are the best clue for market behaviour. A correlation break that lasts for one-to-two days and can indicate a movement to follow that lasts for 2-3 months." He also stated that more than 50% of a macro trader's insight comes from understanding the message of the markets, that is the behavioural inference is key. Like many traders, including those with a macro framework, the presenting macro trader only puts capital to work if the market has already started to move in the direction he wants to play.


Sizing

Sizing of positions in macro is usually a function of risk/reward and correlation. The senior trader didn't mention correlation himself in this regard, so we'll concentrate on the potential profit and loss as the key input to position sizing. The target price and stop loss levels for positions in markets are typically placed at or near significant support and resistance levels – the difference between current price levels and these two levels gives the upside/downside ratio for the potential trade. The potential loss between current levels and the stop is used to scale the maximum position size. A loss of say 5% on a position that is 20% of the gross equity of the fund would give a portfolio level loss of 1%. If two percent loss at the fund level for a single position is the outer bound then a 3% loss to the stop would equate to a 24% of equity maximum position size. The principle is determine how much you are prepared to lose – "anything else is bad discipline, or has ego in it," admonishes the trader.

This particular macro fund also uses drawdown from peak as an additional risk limiter at the level of the individual trader. So the risk capital of the trader will be reduced if his P&L is down 5% from his own peak, and he will be out of the market for a period if he loses 10% from his peak P&L, even if he is still positive on the year.


Closing the Position

The macro trader acknowledged his belief in the concept of reflexivity – Soros' concept that positive price changes themselves impact how positively investors think about the market – such that prices can waterfall down or continue upwards way beyond most expectations. Conceptualising potential price changes and unusual market impacts helps macro traders mentally prepare for a range of market outcomes. But still an all, positions have to be closed even after exceptional profits – so what feeds into the decision making at the closing of a trade? "A position should be reviewed when a price target is hit, and should be closed for sure when a lot of the market has joined you in that position."

How do you make money in macro trading? – "You need to take risk aggressively to make money, but you need to take it well." 


One of the reasons I posted this article is that the trader uses several methods I use in my own style of investing. If you run a hedge fund and would welcome input on your processes (investment, research and risk management) from my consultancy or want to persuade me to share my expertise full-time contact me on s-kerr@tiscali.co.uk