Showing posts with label CTA. Show all posts

Tuesday, 26 April 2011

Selecting the Best Managers – a natural bias to hedge fund managers?

I carried out manager research for an American fund of hedge funds for several years early last decade. Manager research and portfolio construction is a team effort so I had to find a way to put across to my colleagues the merits of the managers I followed. We use a lot of inputs to understand how managers manage capital, so in our heads each of us has a multi-faceted view of the portfolio manager and his process, but it is not feasible to put it all across to someone else. So we have to find ways to summarise and capture the essence of our take on the hedge fund manager.

In my case I used a numeric score of what I considered then, and still do now, the key drivers of performance. So I gave each manager a score between 1 and 10 for each of source of alpha and for risk management. Risk management included portfolio construction, position sizing, diversification, risk measurement, downside risk and use of stops. The source of alpha score took into consideration the added value of the specific person/people pulling the trigger, the breadth and depth of research, whether there was a unique or unusual information source being used, the sustainability of the manager's edge, how adaptable the approach was to change, and the richness of the opportunity set being addressed. A mid-ranking manager would score 6 for each, in the way I used the scales, but this was a closed marking system. No manager ever got 10 for either metric. I never gave any manager a score less than 4 for alpha or risk management in the time I carried out manager research. At the bottom end it is easy to understand why: managers setting up a hedge fund have nearly always has significant success previously in trading or investing. They are not neophytes; and though some learn on the job about managing capital in the hedge fund format, they have all managed capital before.

After a while meeting managers, and hearing how they do what they do, I realised that whilst the alpha score was important, risk management was a bigger differentiator. So getting into risk management issues early in the process saved a lot of time and effort: if a manager didn't have discipline and a consistent process in risk management it was time to move on to another hedge fund.

A legacy of this time is that I remain interested in how to assess managers – it is useful in my consultancy work, at the least. In the book I am reading at the moment – "Investing with the Grand Masters" by James Morton – I am engaged to see what criteria the author used for selection of the managers.

So I was interested to read about the Skandia Investment Group's Best Ideas fund range. Skandia has a fund platform and operates multi-manager funds, but the Best Ideas funds are not a standard fund of funds. Neither are they portfolios of pure hedge funds. These are portfolios of funds (mostly long-only funds) run by well-regarded portfolio managers who have been given the freedom to invest in their highest conviction investment ideas on a dedicated basis.


The lead manager on Skandia Investment Group's Best Ideas fund range, Lee Freeman-Shor, applies four key pieces of academic investment research to his selection process. These are:

1. High conviction investing: Research from Randy Cohen of the Harvard Business School, Christopher Polk and Bernhard Silli of the London School of Economics suggests that the bulk of fund manager's returns come from their highest conviction ideas. As a result the Best Ideas managers are limited to holding only ten stocks, their ten highest conviction ideas.

 2. Kelly Criterion: a formula first described in 1956 by John Larry Kelly to determine the optimal betting size to maximise wealth. Perhaps the most famous Kelly practitioner is Warren Buffet who once said: 'Why not invest your assets in the companies you really like? In 1972 Buffet had 42% of Berkshires assets in American Express. Freeman-Shor allows the managers to apply Kelly to the extent that they can invest up to 25% in a single stock.

3. High Active Share: this measures the proportion of a fund's assets that differ from the benchmark index. In their 2009 paper 'How Active is your fund manager? A new measure that predicts performance' Martijn Cremers and Anti Petajisto indicated that running a fund with a high 'active share' delivers the highest and most repeatable returns. The European Best Ideas Fund has a high active share, currently 83%.

4. Behavioural science: Research by Andrea Frazzini in 2006 showed that the best performing managers realise the highest proportion of losing trades. Freeman-Shor's job as overall portfolio manager is to be a coach and work with the Best Ideas managers to ensure they do not succumb to, amongst other things, sunken cost bias when they are losing and are thus executing their ideas appropriately.


In a good hedge fund there is a competition for capital between the investment ideas – that is, all full sized positions are conviction ideas. So the concept of high conviction investing is seen in the hedge fund world. The Kelly Criterion applies in several hedge fund strategies – event driven investing, activist investing, and to a lesser extent in global macro investing. The third piece of applied research might just say why hedge funds have inherent qualities relative to long only strategies, as 100% of many hedge fund portfolios are active bets. There are no index constraints in hedge fund portfolios, though the presence of positions held only to hedge impacts the percentage of the portfolio applied to seek alpha.

The fourth piece of academic research applied to the Skandia Best Ideas funds has a very strong resonance for me. The conclusion from Frazzini is that the best performing managers realise the highest proportion of losing trades. From my work with traders I know that this can be applied with minor tweaks in hedge funds: the best traders realise their losses either early, or in line with their stated stop-loss policies. This allows winners to run, and losers to be cut. This characteristic is also often seen in systematic approaches to markets, particularly by CTAs. With good money management it is feasible to run a successful CTA with a hit-rate (percentage of winning trades) of only 35%. The hit-rate in a discretionary money manager has to be a lot higher, and for a fundamentally driven manager with a long holding period the hit-rate can get into the high 80's as a percentage.

The fruit of the application of these concepts has been good – the Skandia European Best Ideas Fund has shown some strong out-perfromance. On the third anniversary since launch the fund was 17% ahead of the MSCI Europe index and 15% ahead of its peer group (Morningstar European Large Cap Blend), putting it in the top 5% of European funds since inception and 1st quartile over all time periods.

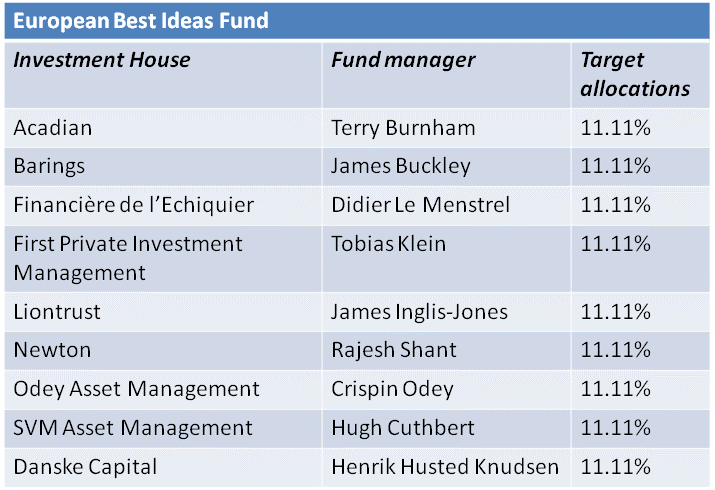
There are a number of hedge fund managers and managers of absolute return funds amongst the roster of managers employed by Skandia in the Best Ideas Funds. In fact I would go so far as to say that there is a disproportionate number of such managers amongst the portfolio managers used (see tables below). Would that be because hedge fund managers tend to apply the best portfolio management practices given by Skandia more than long-only managers?



Tuesday, 23 November 2010

Strategy Allocation in Funds of Hedge Funds - IAM as an example

International Asset Management Limited is Investment Manager for Alternative Investment Strategies Limited, a Channel Islands Listed diversified portfolio of hedge funds. Through the Channel Islands Stock Exchange some top level information is made available.

For example, the strategy allocation as at 30 September 2010 was

Long/Short Equity
30.7
Macro
18.4
Credit
11.4
Fixed Income Rel Val
10.9
Event Driven
10.3
Multi-Strategy
9.4
Trend Followers / CTAs
5.3
Cash & Receivables
3.5
Fund of Funds
0.1
Source: International Asset Management Limited

Strategy allocation at a fund of hedge funds at any one time is a function of a range of factors covering the practical and the structural:
forecast returns per strategy, fund, and underlying market;
macro factor forecasts;
correlation and variance forecasts (or at least assumptions of stability);
fund historic performance compared to peer groups and strategy index returns;
benchmark weightings, normal allocation range per strategy;
strategic biases, and tactical shifts; 
cash flows, and liquidity of the underlying funds (notice period for redemption); 
frictional costs (spread on fund dealing, forward pricing, spread on underlying securities, redemption fees, premium or discount on traded funds, commissions);
and illiquid security constraints (side pockets and side cars).

In addition managers have the subjective influences to cope with - there will be anchoring to the selections made previously, both by strategy and by manager. There are relationships with managers to maintain, and not a single hedge fund manager likes receiving redemption notices, even if they are described to the fund manager by the investor as "rebalancing" or "just trimming an overweight". One investor I know told me that when he tried to diversify away from his very large holding in Soros' Quantum Fund by recycling just some of his gains in the fund, Soros told him it was all or none. He could take it all out or leave it all in but could not limit his exposure at the margin.This is where rationality meets a business man overseeing a business, and it is not seen as constructive in any way by the latter.

Still and all, the fund of funds managers have to manage. In former times, when positive fund flows extended to funds of funds as well as single manager hedge funds, the job of strategy/fund allocation was a lot more simple. The new inflows could be directed to the currently preferred funds and those that were being de-emphasised could be diluted down without any need for redemption notices.  That all stopped in mid 2008. Since then strategy allocation in funds of funds has required (for most funds of funds for most of the time) a redemption for every subscription. Given that there was a persistence of net redemptions as a businesss background for funds of funds well into this year it has been very challenging to activelly allocate to strategies and individual hedge funds since.

One of the advantages of the Listed (funds of) hedge funds is that they are closed-ended vehicles: the capital, if not permanent capital, is there for a finite medium-to-long-term period. This does not get over the need to redeem from one fund to subscribe to another, but at least for the Listed funds of hedge funds there has not been a wall of redemptions to cope with. And if market demand allows there may be tranches of new capital raised for quoted vehicles, to mimic the positive allocation/dilution tactic of open ended funds of funds that have positive flows.

The way that International Asset Management (IAM) has used this capacity to allocate to strategies is shown in the following table.


Strategy Allocation at Quarter End through 2010

3Q
2Q
1Q
4Q’09
Long/Short Equity
30.7
27.4
38.2
35.4
Macro
18.4
17.7
16.9
17.2
Credit
11.4
9.5
9.2
8.3
Fixed Income Rel Val
10.9
11.4
8.9
8.2
Event Driven
10.3
11.9
9.5
12.1
Multi-Strategy
9.4
10.3
6.9
6.9
Trend Followers / CTAs
5.3
7.6
10.5
9.5
Cash & Receivables
3.5
4.1
-0.2
2.1
Fund of Funds
0.1
0.1
0.1
0.3


Source: International Asset Management Limited


A couple of strategy shifts are clear from this time series. In early 2010 capital was taken from Event Driven funds and allocated to Long/Short Equity. After the first quarter CTAs and Equity managers were used as sources of capital for additions to weightings in Multi-Strategy, Credit and to raise cash.


Rather like the approach to hedge fund investing taken by the Common Fund in the U.S., it seems that IAM used a core/satellite approach to portfolio construction, as the Top 10 holdings in Alternative Investment Strategies Limited has been very stable over the last year. The funds listed at the latest data point are shown below.

The Top 10 Holdings as at 30 September
Cobalt Offshore
5.82%
IAM Trading Fund
5.25
Claren Road Credit
4.87
SCP Ocean
4.86
Capula Global Relative Value
4.72
Arrowgrass International
4.71
WCG Offshore
4.66
York European Opportunities
4.64
Prologue
4.41
Diamondback
4.40
Source: International Asset Management Limited

The funds are the same as at the start of the year with only one exception (highlighted). The Top 10 funds accounted for 48.34% of the capital at the three-quarter stage.

The Top 10 Holdings of Alternative Investment Strategies Limited as at 31st December 2009
Cobalt Offshore
5.5%
SCP Ocean
4.75
IAM Trading Fund
4.74
Plainfield
4.62
York European Opportunities
4.20
Capula Global Relative Value
4.15
WCG Offshore
4.13
Claren Road Credit
4.11
Diamondback
4.06
Prologue
4.01
Source: International Asset Management Limited

There is a continual battle in reality and in marketing pitches about the relative contribution of the top-down (strategy allocation) and bottom-up (manager selection) in funds of hedge funds. The long list of practical difficulties given here shows that specifically since mid-2008 funds of funds have had less degrees of freedom in both of those regards than they had previously enjoyed, and that though there may be disappointment over the returns from funds of hedge funds over that period, there are also generic reasons why they have been as limited as they have been. There are other reasons for the under-performance relative to hedge fund indices and hedge fund averages, but they can be explored at another time.


Footnote: The net asset value performance of Alternative Investment Strategies since inception in December 1996 to 30 September 2010 is 146.84%, equivalent to an annualised rate of 6.75%.

ADDITIONAL: UBP ON STRATEGY ALLOCATION  (from their Outlook for 2011)
Larry Morgenthal, CIO of Alternative Investments at UBP Asset Management, believes that reports of the demise of hedge funds are premature. He is quite positive about the industry and believes hedge funds remain an attractive proposition: they provide diversification benefits and they have strong alpha generation potential.

With respect to the various hedge fund strategies, Larry Morgenthal goes on to say, "Allocating between hedge fund strategies is in some respects like dating - we have had a great relationship with credit, are having an affair with long-short equity and think that emerging markets could be marriage material, while macro is like an old flame - not large in the picture now but one we expect to get back together with in the future."

ADDITIONAL TWO: Send me some examples of funds of hedge funds strategy allocations (letters) and I will post a range of them here.

Tuesday, 31 August 2010

Best Performing Hedge Fund Strategy in Next 6 Months - Poll Results

For most of this month a poll has been running for visitors to vote for what they see as the best performing strategy over the next six months. The strategy range was taken fron the Dow Jones Credit Suisse Hedge Fund Indices, and the results were, in order of votes (percentage of votes) and YTD return:

CB Arbitrage 0 (0%), 4.92%

Emerging Markets 0 (0%), 2.69%

Equity Market Neutral 2 (7%), -2.95%

Event Driven 7 (25%), 3.43%

Fixed Income Arbitrage 4 (14%), 6.79%

Global Macro 5 (18%), 4.88%

Equity Long/Short 3 (11%), -0.77%

Managed Futures 4 (14%), -1.24%

Multi-Strategy 2 (7%), 2.15%


Although it would be easy to suggest that the poll results reflect only the performance of the first seven months of the year, as three of the top four performing strategies YTD were selected as expected to be the best over the next six months, that is not the whole story. 
It is pleasing to see some contrarianism amongst the readership - managed futures, by now long overdue for some solid absolute returns, attracted more votes than multi-strategy and equity long/short.

As always, even with vox pop forecasting, there is some insight in it. The hedge fund investment strategy most commonly expected to out-perform the others in the next six months is the event-driven category (distressed, risk abitrage and multi-strategy) .  It is no coincidence that that is the strategy that is mentioned by investors in hedge funds when they are asked by marketers and pollsters where they are currently looking for managers. 

Does this mean investors in hedge funds don't believe that the US economy is in the process of double-dipping? The change in prices of distressed securities are negatively correlated with the economic cycle with a lag, and risk abitrage deal volumes are a function of the capital markets cycles.   


Thursday, 26 August 2010

Another Year Another Challenge for Funds of Funds

In 2008 the fund of funds industry had a tough time producing returns for investors because only 30% of hedge funds produced a positive return. For 2009 things were tough for funds of funds as they couldn't get out of the hedge funds that had let them down by making losses in 2008, because of limited liquidity in the funds, suspended redemptions, and sidecars. Further, few of the funds which made money in 2008 made good money in 2009. So if funds of hedge funds stayed loyal to their winners of 2008 it probably cost them in 2009. There was even a reversal of the size effect on hedge fund returns in moving from 2008 to 2009. 

Before looking at hedge fund returns in 2010, and factors that will impact fund of funds returns, let's look at single manager hedge fund returns in 2008 and 2009 from an absolute and relative perspective.

2008 was an absolute disappointment in terms of hedge fund returns- a loss of around 16%. Last year hedge funds produced their best returns since 1997, at up 19%, by the Greenwich Global Hedge Fund Index. And year to date through July, the same hedge fund index has a small positive return (up 1%), which is not good in isolation as an absolute return over seven months. 

The returns from equities put the absolute returns of hedge funds into some context. Using the S&P500 as a proxy for the equity asset class, the hedge fund returns of 2008-9 look very different. The S&P500 was down 38.5% in 2008, the year hedge funds at an index level lost 16% in a liquidity crisis with high volatility and fraud in the industry, and even so 30% of hedge funds were up.

In 2009 the S&P500 was up 23.5% and hedge funds were up 19%, which given the constrained directionality (beta to markets) is as good as it gets for the alternative funds. Over 70% of hedge funds produced positive returns in 2009.  

This year the S&P is down 4.3% at the time of writing, whilst representative indices of hedge funds are up a small amount.  However the context for hedge fund returns in 2010 is even tougher in some regards than the previous two years. To begin with, let's look at the trajectory of the equity market this year. Below is a one year chart of the S&P500.

source:stockcharts.com


The rally of the second half of 2009 actually peaked in the first few weeks of 2010, and thereafter the stock market has been a rollercoaster of epic proportions, meaning a serious of precipitous falls followed by sharp rises. Monthly index level changes of 7-8% have not been unusual since the outbreak of the Credit Crunch, but the sequences have changed: we had a string of big down months in the bear market to the low in March last year, then a series of big up moves in the massive rally of the last three quarters of last year. In 2010 we have had big up and big down moves alternately. Given that managing the net exposure is typically the biggest risk control variable of most hedge fund strategies (bar the market neutral strategies), this year has been amongst the most difficult market direction background I can recall, as the market was aggressively moving one way and then the other by turns.


Persistence of market movement, or propensity to trend, is different from volatility in traded markets. It turns out that the actual volatility of the S&P500 index, as a proxy for global equity markets, has been both unusually low and then high  this year. The chart below shows 30-day historic or actual volatility of the S&P500.

source: Bloomberg LLP

A level above 25% historic volatility (as opposed to traded volatility) has been uncommon in equity markets, except for short periods, and except for the last two years. The shifts in volatility seen this year would probably have hurt more hedge fund strategies than they helped. Pure volatility strategies should have benefited from the April/May shift in volatility, and the delta hedging of CB arbitrage funds should have had a good background in March and after the June peak in volatility . Overall 51% of hedge funds by number had produced positive absolute returns at the half way point of the year. This hurdle was exceeded by 68% of hedge funds at the end of the first quarter of the year, so the year has got progressively tougher as it has gone on - that falling success rate persisted into the end of August

Hedge Fund Returns by Strategy
source:Greenwich Alternative Investments

Returns by strategy are for the most part marginally profitable or loss making this year. As this is the case, differences in index and sub-index construction and scope have produced different outcomes. What one index provider has as a strategy with a positive return, another shows a negative return for.  Lipper's series of hedge fund strategy indices has only two strategies out of 13 given producing positive returns this year.  Greenwich Global Hedge Fund Indices show only three strategies with negative returns in the YTD (out of a total of 15). Both index providers agree that Long/Short Credit and Convertble Bond Arbitrage are amongst the best strategies for returns so far this year.

Looking across other index providers (Dow Jones Credit Suisse, and Hedgefund.net) it looks as if a small majority of hedge fund indices for strategies produced positive returns in the first seven months of the year. This hit-rate for positive returns by strategy in combination with the dispersion of returns within the strategy has some interesting implications. 


Dispersion of Hedge Fund Returns Within Strategies January-July 2010
source: Lipper, a Thomson Reuters company, TASS database

The dispersion of returns within the investment strategy categories of hedge funds is lower this year than last year. However this year the dispersion ranges for each strategy includes a significantly proportion of negative returns. This is a very different outcome from 2009, when the spread of returns by strategy may have been wider than this year, but returns were overwhelmingly positive. 

The read through to funds of hedge funds will be interesting. Another way of looking at the last two calendar years is that positive returns came from CTA and global macro in 2008, and those two strategies significantly lagged the other hedge fund strategies in 2009. So there were significant returns to active strategy allocation/weightings for investors in hedge funds in both years, though the positively contributing strategies were not consistent through time.

This year, given the dispersion of hedge fund returns within strategies, and with a fair amount of funds with losses as well as funds with profits within each strategy, fund of funds relative returns will be impacted much more by manager selection within each strategy silo than we have seen for a while. Strategy allocation will still have a part to play, but the 2010 ranking of returns from funds of funds will be about old style returns - driven from the bottom up.     

Of course all funds of funds claim that manager selection is a key skill. It will be interesting to see if those managers that make a special play of their abilities at manager selection in their client presentations come through with top ranking returns in 2010.

Thursday, 4 March 2010

PODCAST FOUR – CTA Beach Horizon


A Discussion with Head of Research of Beach Horizon, Dr. Paul Netherwood.
Dr. Netherwood spent four years in the Nineties in trading systems research and development at AHL (Adams, Harding and Lueck, now part of Man Group), and for the last 9 years he has been at Beach Capital Management and Beach Horizon LLP, a systematic fund management partnership. Beach Horizon is based in the City of London.


Clicking on the link will open a page containing the sound file - download or play in your browser


Part One (Link Here) (15 minutes)


 0.00 Introduction to Beach Horizon and sytematic CTAs
 5.50 Portfolio construction and diversification including milk and pork bellies
 9.20 Targets for outputs return and volatility
 10.50 Upside volatility
 11.55 Margin-to-equity as a proxy for risk

Part Two (Link Here) (13 minutes)

 0.00 The team - an advantage in being able to tap into a trader with a discretionary background for idea creation  and assessing research ideas.
 4.45 An FX research project
 6.20 Prioritising research, co-opting the sciences
7.35 Research productivity
10.00 People power - intellect is not scalable
12.05 Beyond trend-following - different frequencies

Part Three (Link Here) (8 minutes) 

0.00  Different time horizons of investors - a dominant frequency
1:06 Performance of CTAs in 2008
3.40 Performance in 2009
5.06 Current Drawdown - when will we see outperformance of CTAs? Influence of QE?


Drawdown Analysis for Beach Horizon May 2005 to December 2009


Source: Beach Horizon Database


My thanks go to Dr. Paul Netherwood for his contribution to this podcast.

Tuesday, 23 February 2010

Insight into European Hedge Funds from FSA Report

The FSA’s report, ‘Assessing possible sources of systemic risk from hedge funds’ was released today and is available from the FSA at http://www.fsa.gov.uk/pubs/other/hedge_funds.pdf. It offers some insights into leverage, margining, liquidity and the distribution of fund returns of the largest funds under the FSA's jurisdiction. The FSA regulates over three-quarters of Europe's hedge fund industry, so this is an insight into the whole of the European industry, by proxy.


Gross Exposure of London's 50 Largest Hedge Funds in October 2009


  • There is a pronounced phenomena that fixed income funds (including credit L/S) need a larger gross to deliver alpha. Multi-strat funds typically have a fixed income sub-strategy. 
  • Global macro funds weren't particulalrly levered in October last year - maybe they were largely out of bonds? 
  • Interestingly, the classicly leveraged strategy of managed futures is unlevered according to the FSA's survey results.
  • London's L/S equity funds had a smaller gross than their US counterparts in October.


Fund and Portfolio Liquidity of London's 50 Largest Hedge Funds


Average Margin Requirements for London's 50 Largest Hedge Funds


  • These are first tier hedge fund management companies, so would not suffer first from changes to margining rules by prime brokers. So the stability of margin requirements shown in October 2008 is perhaps understandable for them alone. That the margin requirements went up subsequently even for the top tier hedge funds shows the (lack of) availability of credit in 2009.


Distribution of Fund Returns of London's 50 Largest Hedge Funds in 6 Months to Oct 2009


  • As much as anything else it is impressive how much the distribution of returns across the largest funds in the six months to October 2009 conforms to a (long) option-like payoff profile. Curtailing the downside and top-draw risk management is what investors in first tier funds expect and should get.


Change in Fund AUM of London's 50 Largest Hedge Funds over Six Months to October 2009


  • All funds sufferred redemptions in the first half of 2009. The biggest and best funds had inflows in the second half of the year, but some London-based managers such as Lansdowne had excellent investment perfromance too. Those that performed well in 2009 had inflows and returns contributing to the growth in AUM.


Fund Total Number of Positions of London's 50 Largest Hedge Funds


  • A few of the largest hedge funds in London have less than 50 positions in total.
  • Most of the largest hedge funds managed from London, or where the fund management company if overseen by the FSA (like Moore Capital and Walter Capital, the SAC subsidiary), have 100-500 positions.
  • Some of the multi-strategy funds engaged in statistical arbitrage or high frequency trading run portfolios with more than 5,000 positions. To put this in context there are around 3,000 different companies traded on the London Stock Exchange (excluding AIM).


source of all graphics: FSA