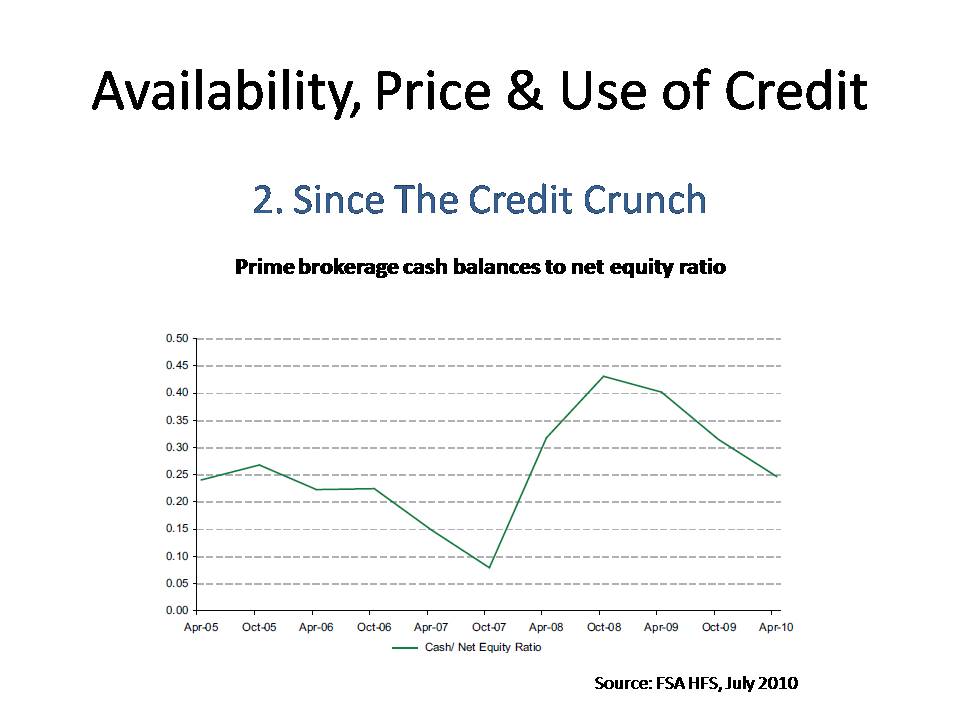
A couple of weeks back I joined in a presentation put on by PRMIA (The Professional Risk Managers International Association) at Imperial College, London. The sessions were on hedge funds and credit risk, and so I tapped into my experience as a risk manager in a single manager hedge fund and what I observed during the Credit Crunch of 2008/9 and explored the contrast in credit conditions for hedge funds between the period before and the period after the Credit Crunch. These are the slides I used:
Showing posts with label borrowing. Show all posts
Wednesday, 28 September 2011
Tuesday, 1 March 2011
Europe’s Big Hedge Funds Not Growing from Net Subscriptions
Every six months the UK's Financial Services Authority conducts the Hedge Fund Survey (HFS) and the Hedge Fund as Counterparty Survey (HFACS) to help the regulator analyse the systemic risk posed by hedge funds. The latest surveys were conducted in September/October 2010, and the results were released yesterday.
The surveys give invaluable insights into the state of the European hedge fund industry. The HFS asks selected FSA-authorised investment managers about the hedge fund assets they manage and the large funds (equal to or greater than US$500 million in AUM) for which they undertake management activities. So the survey is top-down by size, but given the concentrated nature of the industry the survey well reflects the European industry as a whole, the UK regulator overseeing funds controlling around 80% of the European end of the industry.
The September 2010 survey covered about 50 investment managers with just over 100 funds qualifying by size. Together these firms reported approximately US$380 billion of hedge fund assets under management. The FSA estimate that the HFS captures approximately 20% of global hedge fund industry assets under management. Major American hedge fund groups with a London office, such as Highbridge and Moore Capital Management, will be in this survey.
There are a number of interesting and significant results in the survey:
1. Net subscriptions for large funds were negative in the six months to September 2010.
Chart 1. Distribution of Change in Large Hedge Fund AUM for the 6 months to end September 2010
3. Large funds in Europe have recovered to their high-water mark
4. Hedge fund managers in aggregate have been able to agree a lengthening of their term of credit.
Chart 3. Average Excess Collateral Held by Prime Brokers – Collateral as a percent of base margin
7. The relative decline of funds of hedge funds within the industry is illustrated again
Chart 4. Sources of Hedge Fund Capital for Large Funds at September 2010
source: FSA
Parenthetically, the FSA survey suggests that hedge fund managers themselves own over $30bn worth of their own hedge funds.
The surveys give invaluable insights into the state of the European hedge fund industry. The HFS asks selected FSA-authorised investment managers about the hedge fund assets they manage and the large funds (equal to or greater than US$500 million in AUM) for which they undertake management activities. So the survey is top-down by size, but given the concentrated nature of the industry the survey well reflects the European industry as a whole, the UK regulator overseeing funds controlling around 80% of the European end of the industry.
The September 2010 survey covered about 50 investment managers with just over 100 funds qualifying by size. Together these firms reported approximately US$380 billion of hedge fund assets under management. The FSA estimate that the HFS captures approximately 20% of global hedge fund industry assets under management. Major American hedge fund groups with a London office, such as Highbridge and Moore Capital Management, will be in this survey.
There are a number of interesting and significant results in the survey:
1. Net subscriptions for large funds were negative in the six months to September 2010.
Aggregate assets under management increased in the survey period due to positive performance. But the picture of subscriptions and redemptions was more mixed. Approximately one half of large funds in the September 2010 survey reported a decline in AUM driven by negative net subscriptions (Chart 1). In aggregate, negative net subscriptions reduced assets under management by 0.8% versus the aggregate assets at the start of the survey period.
source: FSA
2. There was little change of the size of hedge fund assets in side pockets "Assets under special arrangements due to their illiquid nature, such as in 'sidepockets', remained largely unchanged at 11% of aggregate NAV, suggesting no improvement in the quality of these assets," according to the FSA.
Assets below their high-water mark have declined to less than 5% of total surveyed assets, down from 43% reported in the October 2009 survey. So the profitability of European hedge fund management companies should be much improved in 2011.
4. Hedge fund managers in aggregate have been able to agree a lengthening of their term of credit.
The term of financing has been 'pushed out' in aggregate, with a reduction in short-term financing of between 5 and 30 days and an increase in financing terms of 31 to 180 days (Chart 2). This gives more potential for stability within the portfolios, as positions will not have to be reduced because of a shortage of short term finance, as can happen when short term financing is rolled over on a frequent basis. The leverage providers are overwhelmingly the prime brokers.
Chart 2. Financing Term – Percent of financing by dayssource: FSA
5. The average excess collateral held by prime brokers is as at the low end of the 5 year range.The Hedge Fund as Counterparty Survey suggests that the average excess collateral is currently around 90% of the base margin required (Chart 3).The FSA notes that there have been developments in hedge funds' cash management which may impact the movement of collateral, such as an increased use of custody accounts for excess collateral.
Chart 3. Average Excess Collateral Held by Prime Brokers – Collateral as a percent of base margin
source: FSA
6. Commodity futures positions of hedge funds has become an issue of note to regulators, and should be one to investors and the funds' managers. According to the FSA the footprint of surveyed hedge funds within markets is generally small when measured by the value of their holdings, suggesting that in aggregate they do not have a major presence in most markets. However, the regulator for most of Europe's hedge funds states that there are potential exceptions in convertible bonds, interest rate and commodity derivatives. Hedge funds have been nearly 5% of the open interest in commodity markets in the last year. These positions might be held for reasons of medium term value, but for most hedge funds the holdings are governed by momentum-based tactics. So the exit may become very crowded in some of the smaller commodity markets where hedge funds are relatively new, if large, market participants.
7. The relative decline of funds of hedge funds within the industry is illustrated again
FSA survey data shows (Chart 4) that the large hedge fund groups have well diversified sources of capital for their larger funds. A surprise in this analysis is the low percentage of capital of large hedge funds routed via funds of hedge funds – only 28% (or less) of capital of large hedge funds was contributed by funds of funds (and other funds). There may be some under-estimate of total holdings of endowments and pension plans in this data, as these institutions and HNWIs may have hedge fund exposure via FoFs as well as through direct holdings. However it is difficult to refute that funds of funds are contributing much less of the capital of large hedge funds in 2010.
Chart 4. Sources of Hedge Fund Capital for Large Funds at September 2010
source: FSA
Parenthetically, the FSA survey suggests that hedge fund managers themselves own over $30bn worth of their own hedge funds.
Tuesday, 5 October 2010
Borrowing, Shorting and a New Wave of Talent for Hedge Funds
The International Securities Lending Association held a briefing last week which disclosed some good industry level data on stock/security borrowing: the arrangements that facilitate shorting.
One of the effects of the Credit Crunch of 2008/9 was that counterparty risk became a major concern. Who you lend to, the quality of collateral, and documentation related to these factors became major operational issues. In a climate in which it became difficult to know for sure who would be around to deliver either collateral or borrowed securities back again the next week, it was inevitable that the willingness to lend declined. Graphic One illustrates that the assets available to borrow fell by 30% in the 4Q of 2008.
Graphic One
The low point for lendable assets coincided with the low for equity markets in March 2009. As a result of implicit government guarantees and the move to bank holding company status for some banks, clients regained comfort with the securities lending market, and lendable assets have been increasing to pre-Crunch levels.
Whilst the willingness to lend has returned to levels seen previously, the desire to borrow securities has not returned to anything like the same degree. On-loan balances, that is the amount of securities actually borrowed, remains at around half the level seen in the first half of 2008 (see Graphic Two).
Graphic Two
There are a number of reasons why the volume of securities borrowed has declined and stayed at a new lower level. The borrowers of securities would be hedge funds and proprietary trading teams. Capital in the hedge fund industry dropped by 40% from mid-2008 to mid-2009. In the period of the Credit Crunch proper the capital used by prop desks was needed elsewhere in the businesses. In the period after there were regulatory inhibitions on capital devoted to prop trading. For both types of borrowers of securities many of the those that engaged in running funds or prop capital had reduced risk appetites or measured such high correlation and volatility in the markets in which they traded that they need less capital to put the same amount of risk on.
Graphic Three
Of course another, if not the, major factor was that financing new borrowings of any sort became extremely difficult - so leverage fell across all activities funded by short term borrowing, including prop trading and hedge fund position financing. The massive de-leveraging is illustrated in Graphic Three, which shows a 62% fall in leverage from 2008 to 2010.
Capital allocated to prop desks today is down by an estimated 90% from the 2008 levels, and will go lower as banks such as Goldman Sachs and JP Morgan have announced they will withdraw from the activity.
Securities are borrowed in order to carry out a number of shorting strategies: hedging activity to offset long exposures, arbitrage trading to capture mispricing opportunities, and strategies to benefit from corporate changes such as mergers and acquisitions. Whilst there may still be a need for large scale hedging, and there have been gross arbitrage opportunities in the last 18 months, the volumes of M&A deal flow have been down significantly (see Graphic 4).
Graphic Four
Subscribe to:
Posts (Atom)